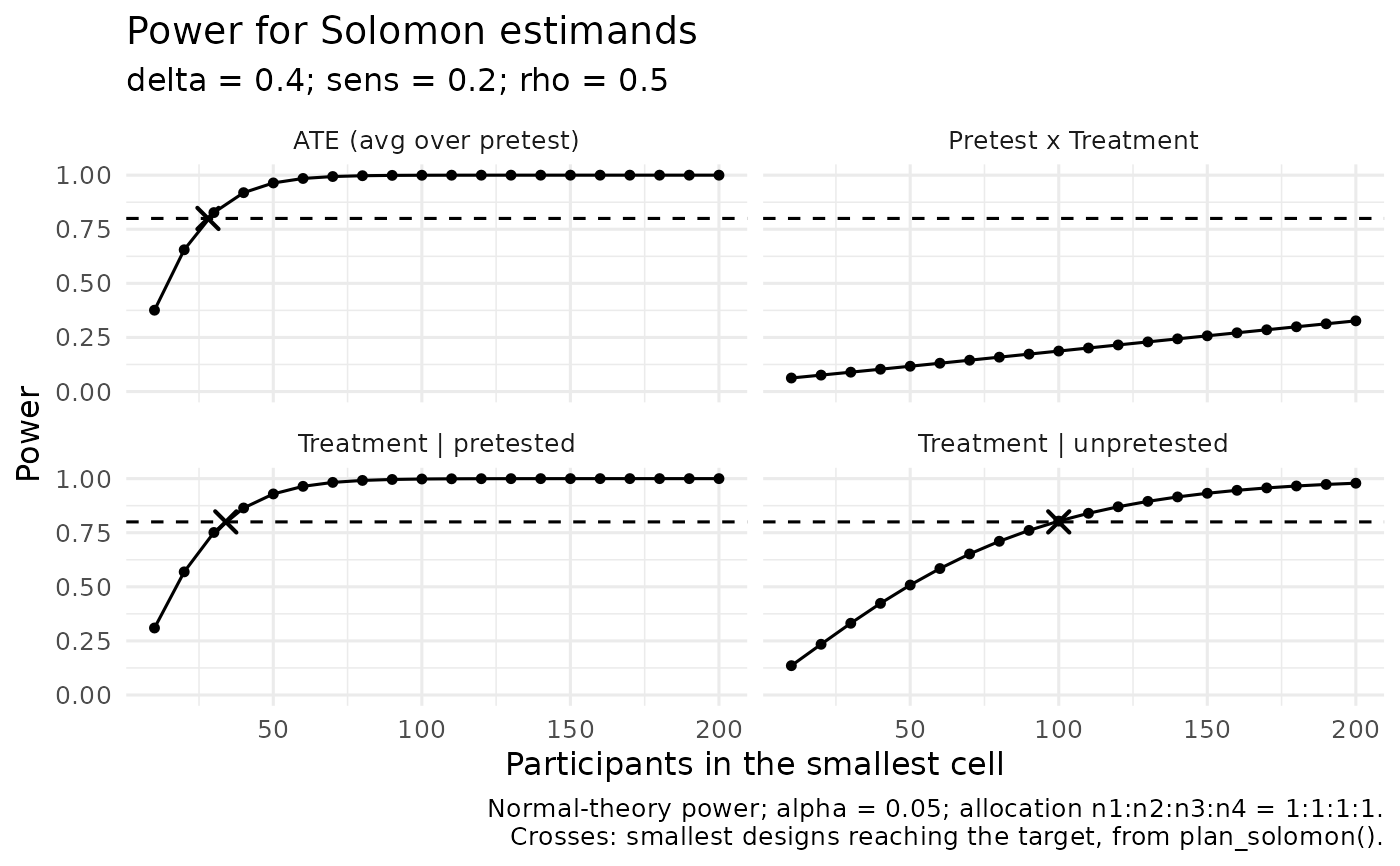
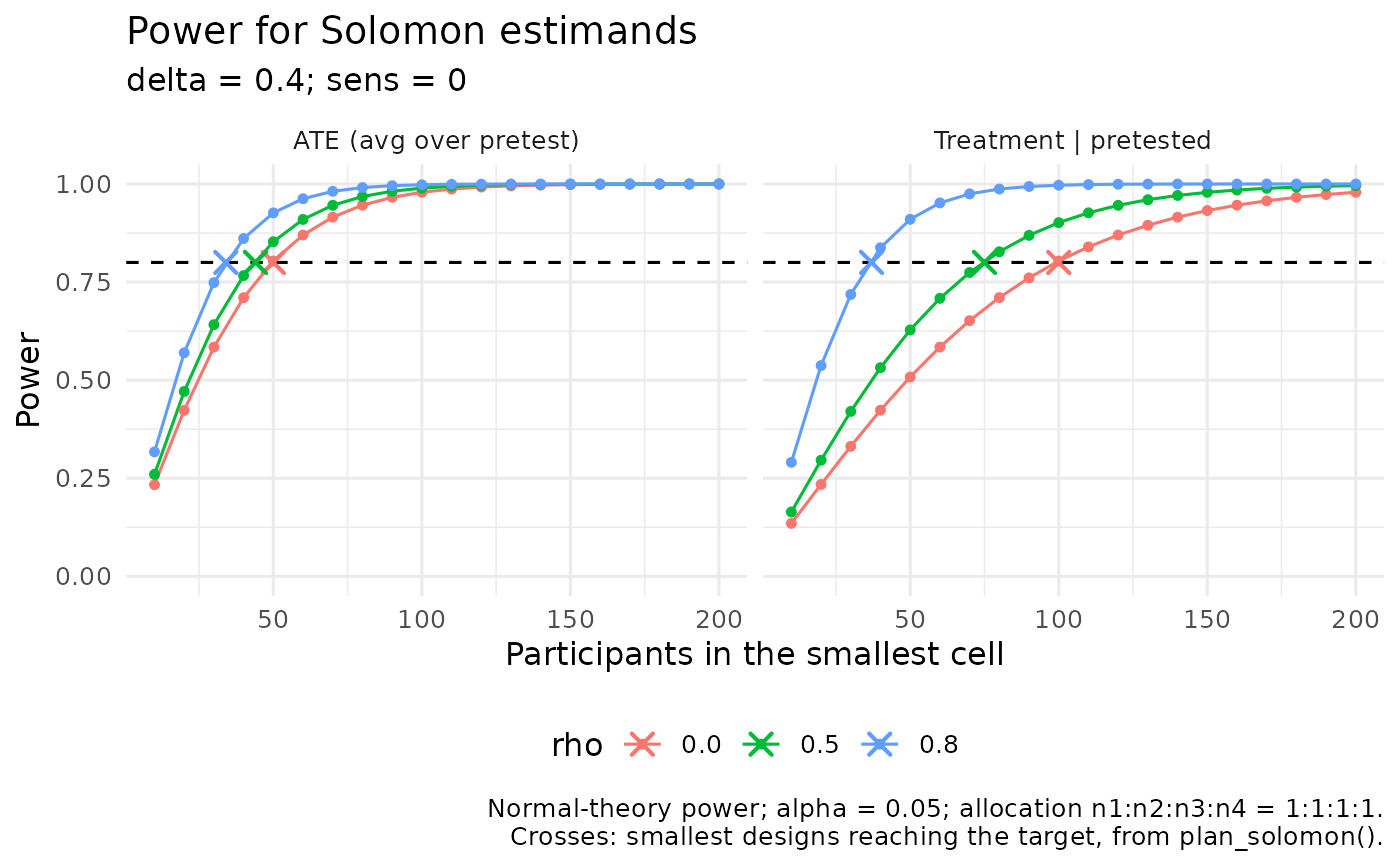
Draws power against sample size for each Solomon estimand, so the effect of
cell size, effect size, pretest-posttest correlation, and sensitization on
a planned study can be seen rather than read from a table. A horizontal
line marks the target power, and each curve is annotated with the design
plan_solomon() returns for that target.
Arguments
- n
Sizes of the smallest cell to plot. Other cells follow
allocation.- delta, sens, rho
Treatment effect among unpretested participants, sensitization, and pretest-posttest correlation, as in
power_solomon(). At most one of them may have more than one value; that one is shown by color.- sigma
Posttest residual standard deviation in all cells.
- alpha
Two-sided significance level. Default is 0.05.
- estimand
Estimands to plot: any of
"ate","sensitization","pretested", and"unpretested".- allocation
Relative cell sizes for
n1ton4, as inplan_solomon().- target
Target power marked on the figure. Default is 0.80. Use
NULLto omit the target line and the planned designs.- method
"analytic"(default) or"simulation".- sims
Replications per point when
method = "simulation".- seed
Optional seed for
method = "simulation".
Details
Curves use the normal-theory power calculations validated for
power_solomon() by default. With method = "simulation", each point is
the rejection rate of the package's own GLM test from power_solomon(),
shown with a band of two Monte Carlo standard errors.
Power differs sharply between estimands: the sensitization contrast has four times the sampling variance of the average treatment effect, so its curve rises far more slowly. The figure is faceted by estimand to keep that difference visible.