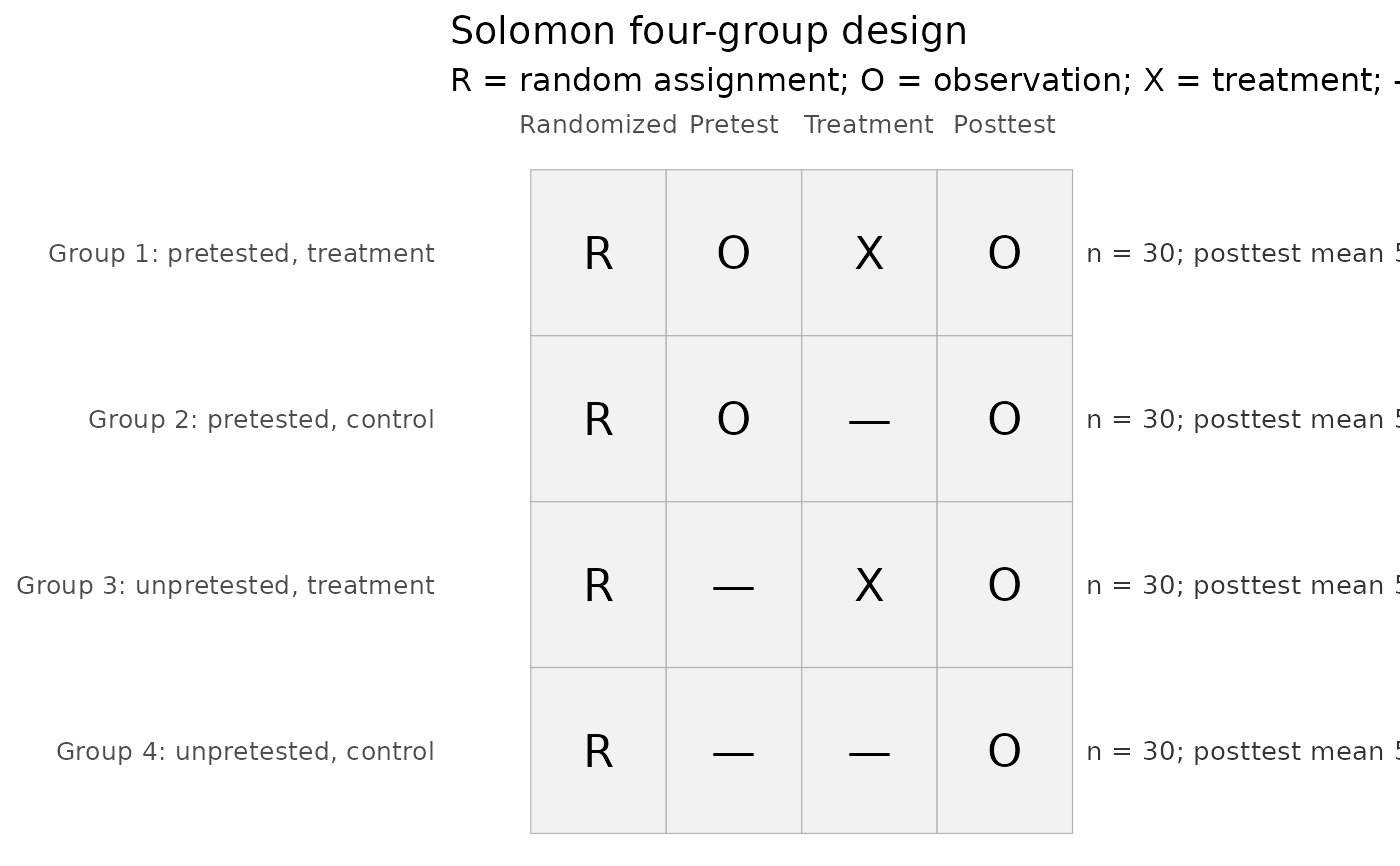
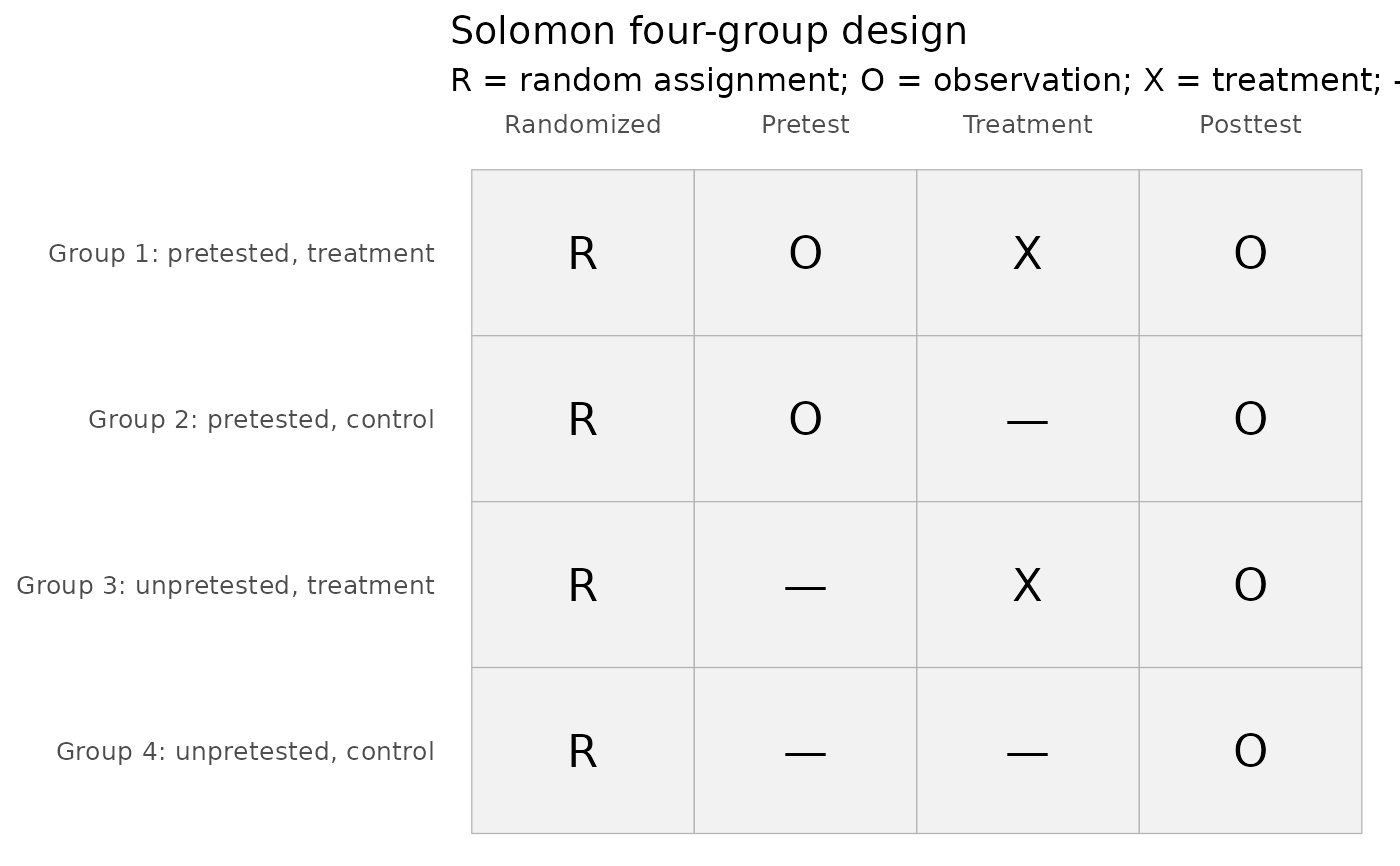
Draws the Solomon (1949) four-group design in the notation of Campbell and Stanley (1963): each row is a randomized group (R), O marks an observation (pretest or posttest), and X marks the treatment. Groups 1 and 2 are pretested; Groups 3 and 4 are not, by design, so their missing pretest is part of the experiment rather than missing data.
Arguments
- x
Optional. Either a fit from
fit_solomon_glm()or a numeric vector of posttest scores, in which casetreatandpretestedare also required.- treat
Treatment indicator coded 0 = control and 1 = treatment, when
xis a vector of posttest scores.- pretested
Pretest indicator coded 0 = unpretested and 1 = pretested, when
xis a vector of posttest scores.
Details
Called with no data, the function draws the generic schematic used for
teaching. Given data or a fitted model, it labels each group with its size
and posttest mean. Groups with no participants, or with fewer than two
observed posttest scores, are flagged, using the same rule as
validate_solomon().
References
Campbell, D. T., & Stanley, J. C. (1963). Experimental and quasi-experimental designs for research. Rand McNally.
Solomon, R. L. (1949). An extension of control group design. Psychological Bulletin, 46(2), 137-150.
Examples
plot_solomon_design()
 with(solomon_example, plot_solomon_design(y_post, treat, pretested))