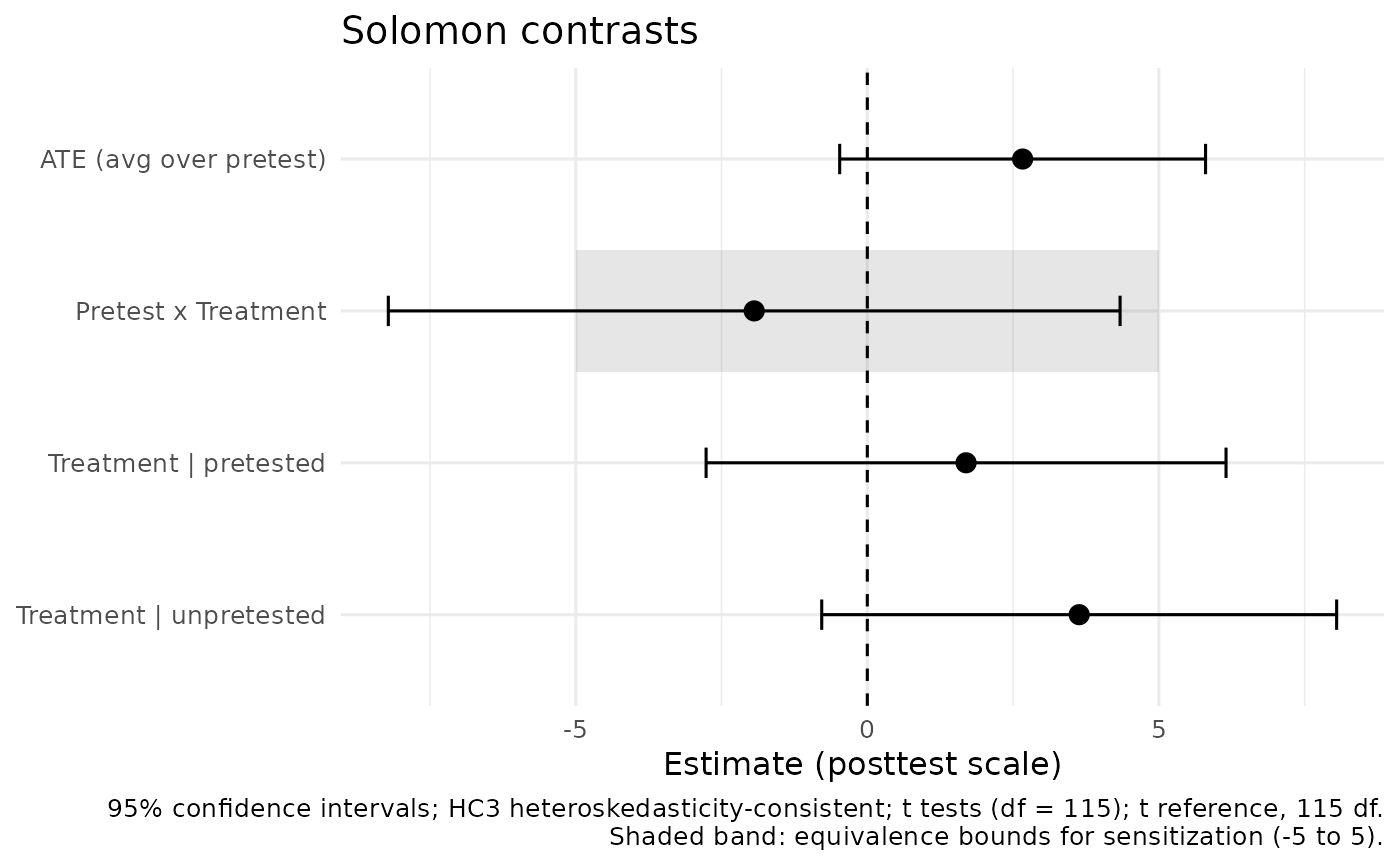
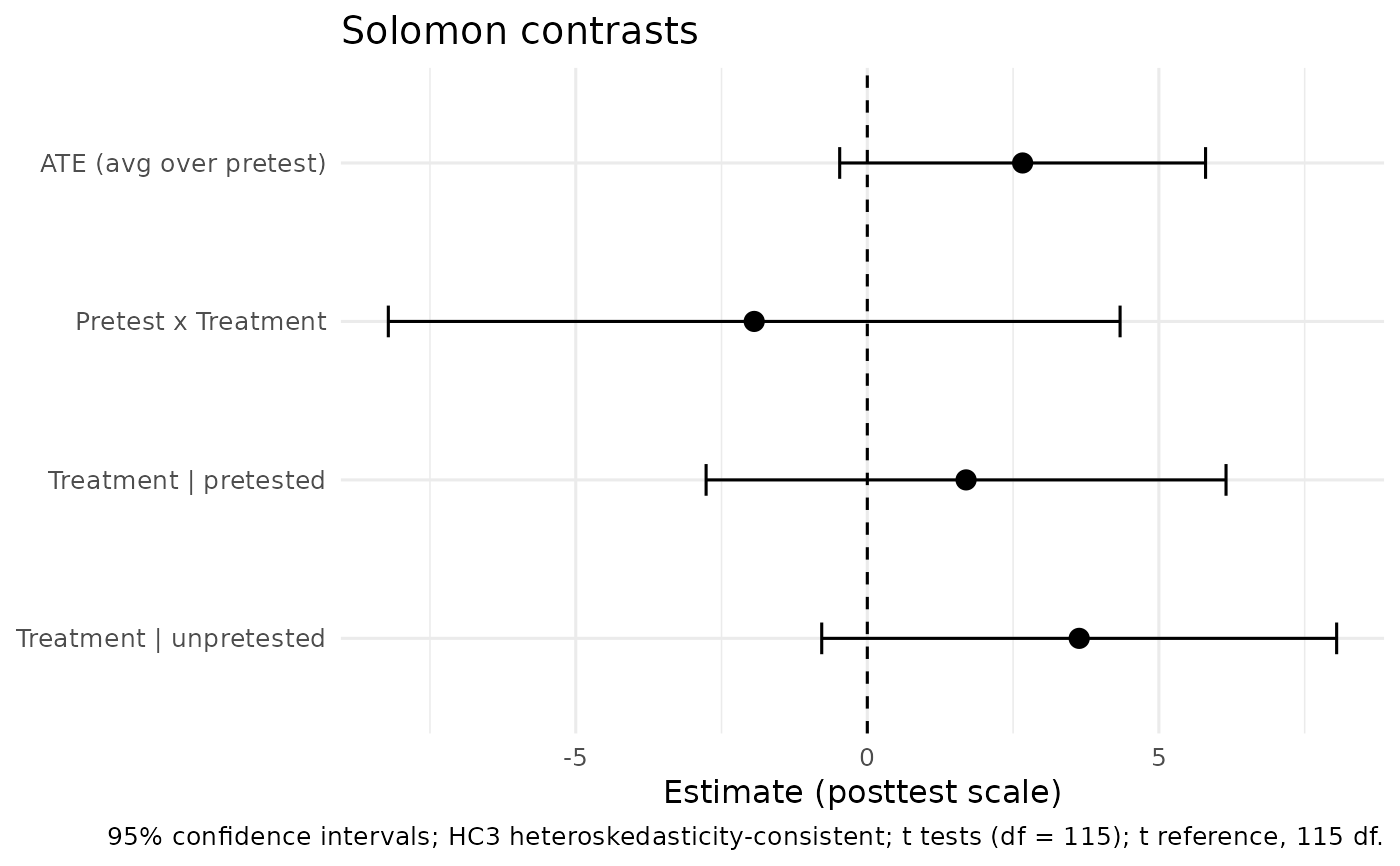
Plots the four Solomon contrasts from a fitted model: the average treatment effect across pretest conditions, the Pretest x Treatment sensitization contrast, and the treatment effects among pretested and unpretested participants, each with its confidence interval and a reference line at zero.
Arguments
- fit
A fit from
fit_solomon_glm(),fit_solomon_ml(),fit_solomon_sem(), orfit_solomon_sem_latent().- bounds
Optional equivalence bounds for the sensitization contrast, as one positive number or
c(lower, upper), drawn as a shaded band on that row. Use the same bounds asequivalence_solomon(), fixed before the data were examined.
Details
Estimates and intervals are taken unchanged from the fitted object, so the figure agrees with its printed output, and the caption states the confidence level and the reference distribution the model used. Contrasts a model does not estimate are omitted and named in the caption rather than drawn as zero.
Examples
fit <- with(solomon_example, fit_solomon_glm(y_post, treat, pretested, y_pre))
plot_solomon_effects(fit)
 plot_solomon_effects(fit, bounds = 5)