Draws the two questions a Delphi asks, one at a time: whether the panel agrees, and whether it has stopped moving. Both are trends across rounds, which a plot shows better than a table of round pairs.
Arguments
- x
A fitted
contentvalid_delphiobject.- type
"consensus"(default),"stability", or"distribution".- show_legend
Draw the legend. Defaults to
TRUE.- apa
TRUE(default) draws in black, white and gray, as an APA figure is printed: in the distribution view darker means a higher rating, and in the consensus and stability views each item's line is a shade of gray from black to mid gray, named by the label at its end.FALSEdraws for slides and posters: the distribution view shows ratings below the agreement cut in brown and ratings at or above it in teal, a colorblind-safe scheme, and the consensus and stability views give each item's line its own color.- labels
For
type = "distribution", one label per rating category, lowest first. Defaults to"Rated 1","Rated 2", and so on.- which
The name
typehad before 1.0, still accepted so earlier code runs:plot(fit, which = "stability")istype = "stability". Give one or the other: supplying both is an error.- ...
Passed to
graphics::plot().
Details
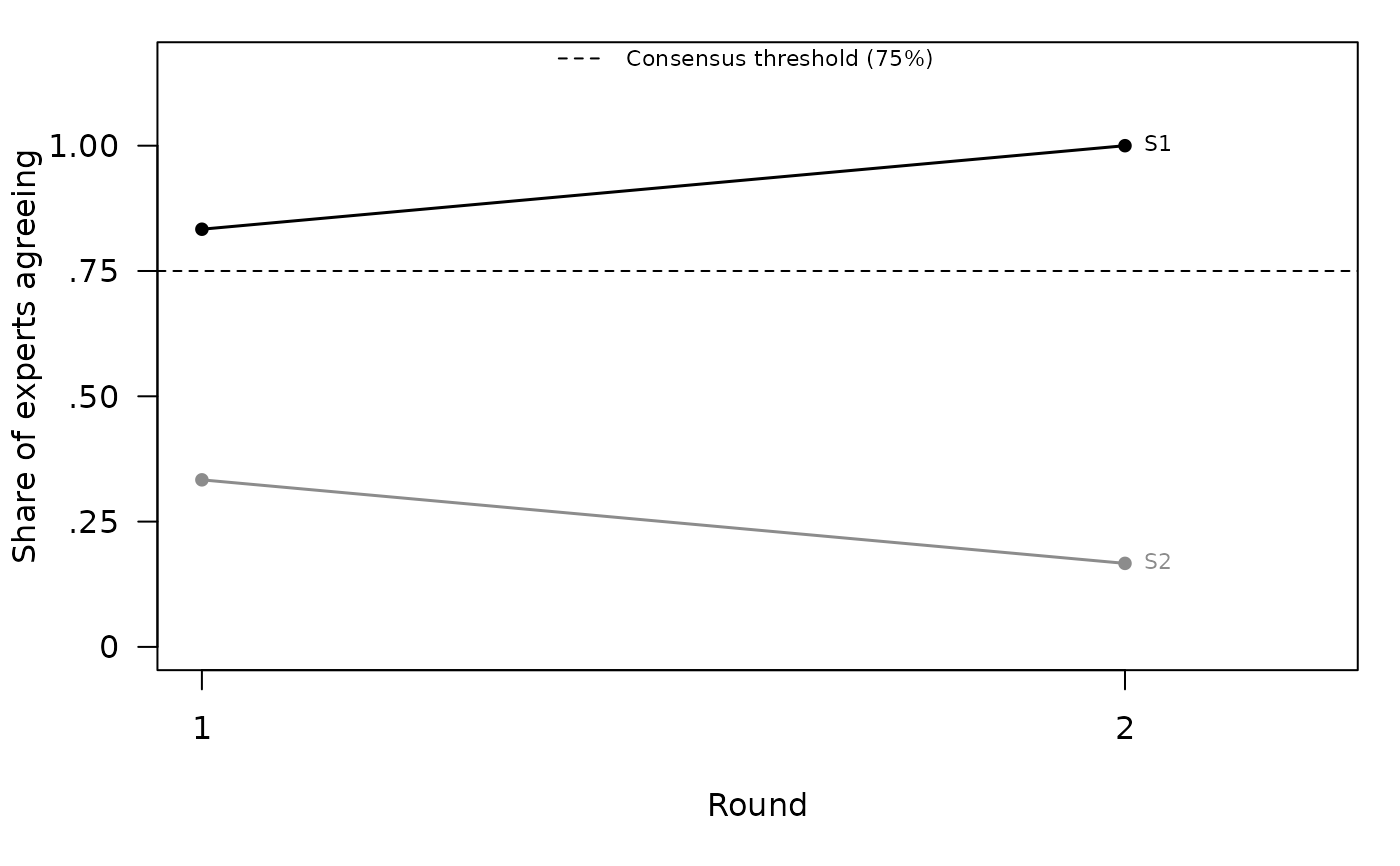
type = "consensus" draws each item's share of experts agreeing, round by
round. A line that stops early belongs to an item that settled and was set
aside. The consensus threshold is drawn only when one was set, because the
analysis applies no threshold without it.
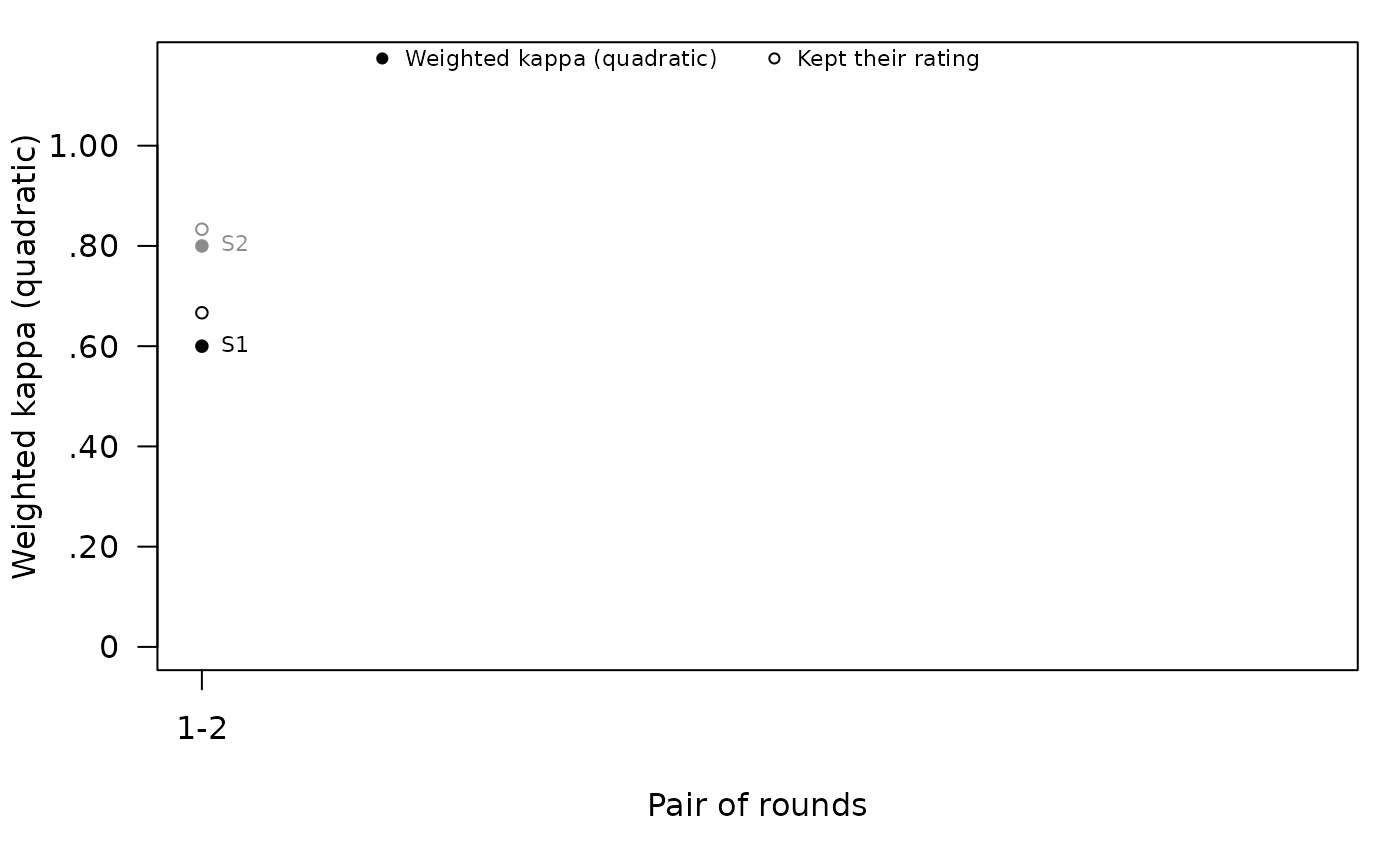
type = "stability" draws the stability statistic for each pair of
consecutive rounds. Beside kappa, lambda and net change, which cannot
exceed 1, the share of experts who kept their rating is drawn as open
circles; a chi-square has its own scale, so it is drawn alone. No bands or
shaded regions are drawn behind kappa: its verbal benchmarks are
arbitrary, and kappa can be low when ratings concentrate in one category,
so a shaded "good" region would mislead exactly when a Delphi is
succeeding. See delphi_validity().
In both line views each item's line is labeled at its last point. Items
with the same values throughout share one line: their labels are set
apart, but the lines lie on top of each other, so only the stacked labels
show that more than one item is there. type = "distribution" draws every
item on its own.
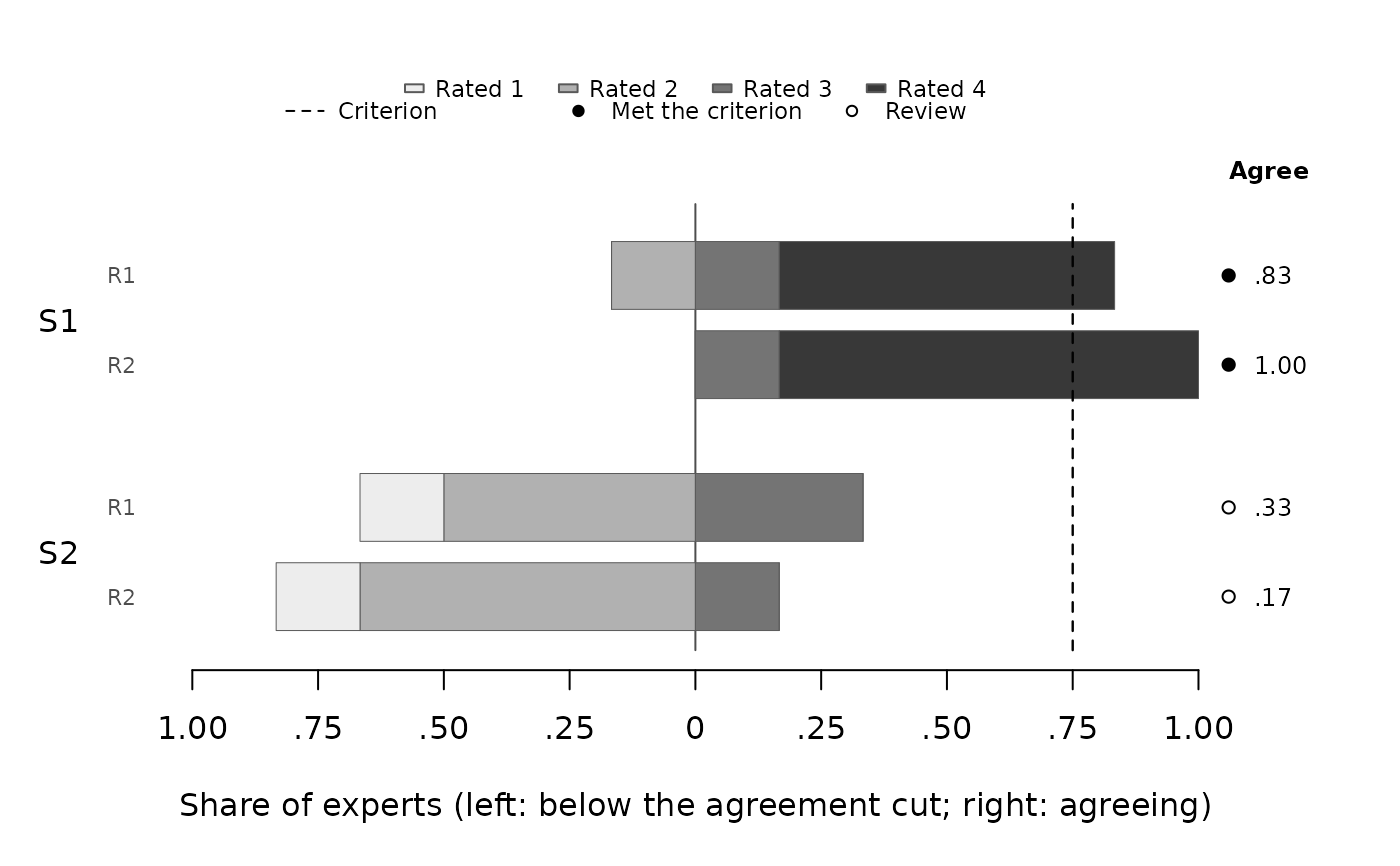
type = "distribution" draws every rating in every round as a diverging
stacked bar (Heiberger & Robbins, 2014), one bar per round for each item,
split at agree_cut. The right-hand length is the share agreeing, read
against the dashed consensus threshold, and the symbol beside it is that
round's consensus decision: a cross where fewer than three experts rated
the item, which is no decision. Rounds in which an item was not rated,
because it had been set aside, are marked "not rated".
References
Heiberger, R. M., & Robbins, N. B. (2014). Design of diverging stacked bar charts for Likert scales and other applications. Journal of Statistical Software, 57(5), 1–32. doi:10.18637/jss.v057.i05
Examples
r1 <- cbind(S1 = c(4, 4, 3, 4, 2, 4), S2 = c(2, 3, 2, 1, 3, 2))
r2 <- cbind(S1 = c(4, 4, 4, 4, 3, 4), S2 = c(2, 2, 2, 1, 3, 2))
long <- function(m, round) {
data.frame(expert = paste0("E", seq_len(nrow(m))),
item = rep(colnames(m), each = nrow(m)),
round = round, rating = as.vector(m))
}
fit <- delphi_validity(rbind(long(r1, 1), long(r2, 2)), lo = 1, hi = 4,
consensus_threshold = 0.75, B = 0)
plot(fit)
 plot(fit, type = "stability")
 plot(fit, type = "distribution")