Draws a mode-specific evidence plot, one row per item with the first item at
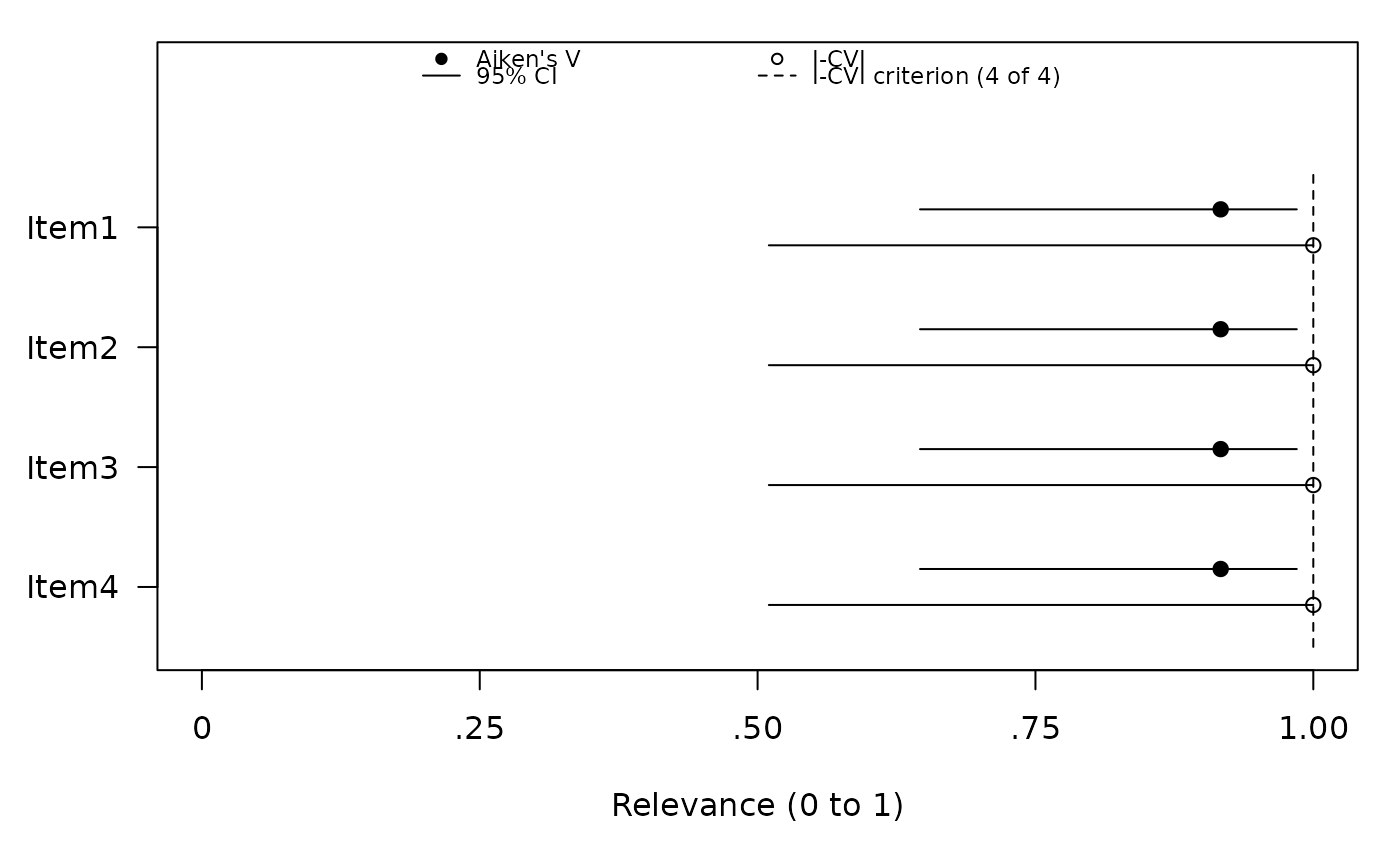
the top. Relevance mode shows Aiken's V and I-CVI side by side, each with its
interval, and a dashed line at the I-CVI criterion when every item had the
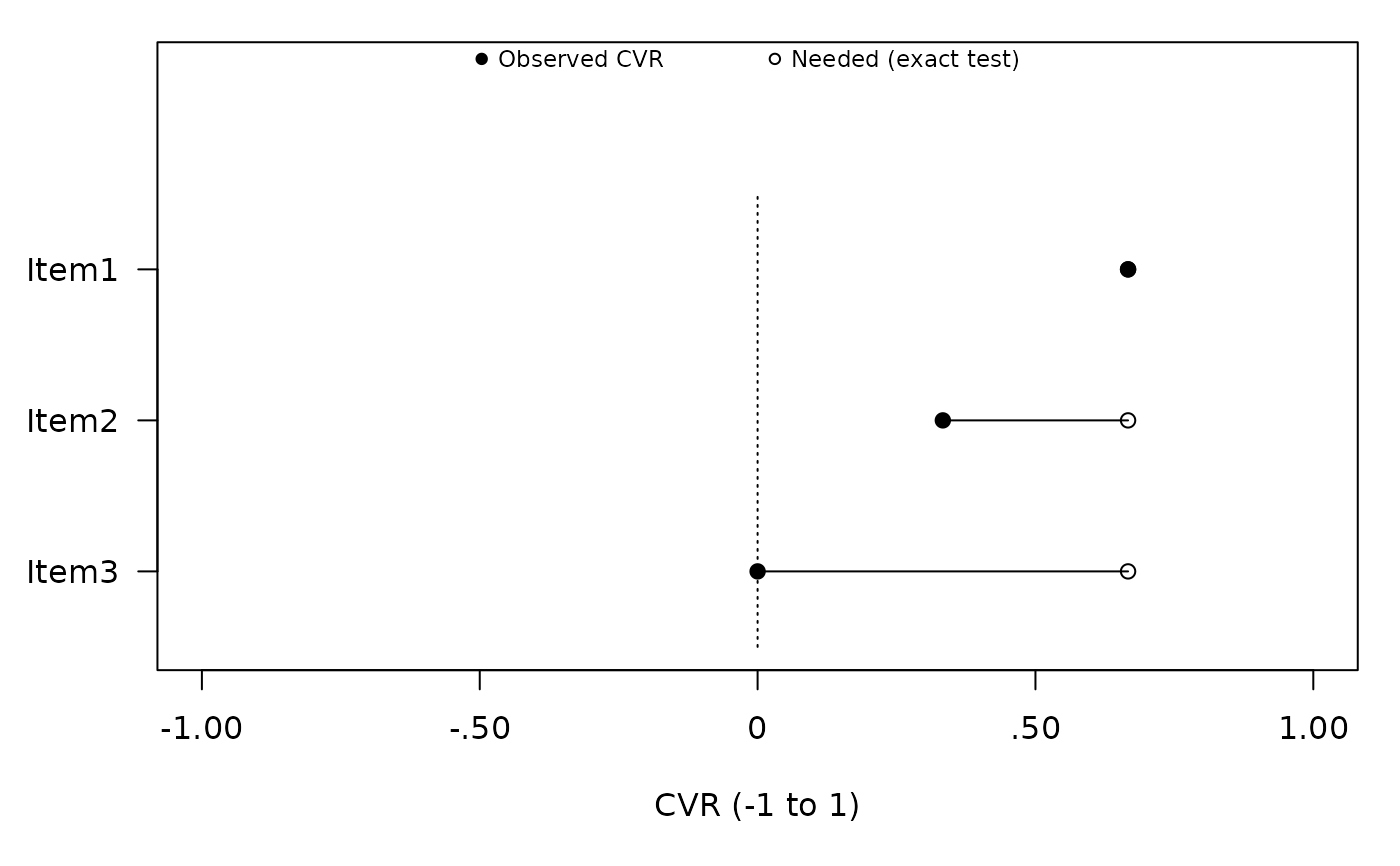
same number of experts. Essentiality mode shows each observed CVR against the
CVR the exact test needs for that item. Congruence mode shows each item's
index for its intended objective against the ioc_cut criterion (dashed),
with the experts' mean ratings on the target (a triangle pointing up) and
on the other objective with the highest mean (pointing down) in gray, when
a target mapping is available; an item with no index is marked with a
cross.
Filled and open symbols mean what the key says. In congruence mode, as in the item-sort and construct-rating figures, a filled index met the criterion and an open one fell below it. In relevance and essentiality mode they tell apart the two values drawn on each row: Aiken's V (filled) from I-CVI (open), and the observed CVR (filled) from the CVR the exact test needs (open). There, an item met the criterion when its I-CVI reaches the dashed criterion line, or its observed CVR reaches the CVR needed. The key sits above the first item and the reference lines, in as many rows as the figure's width needs. The left margin widens for long item names, and a name that would take more than about 40% of the figure's width is shortened in the middle with "...".
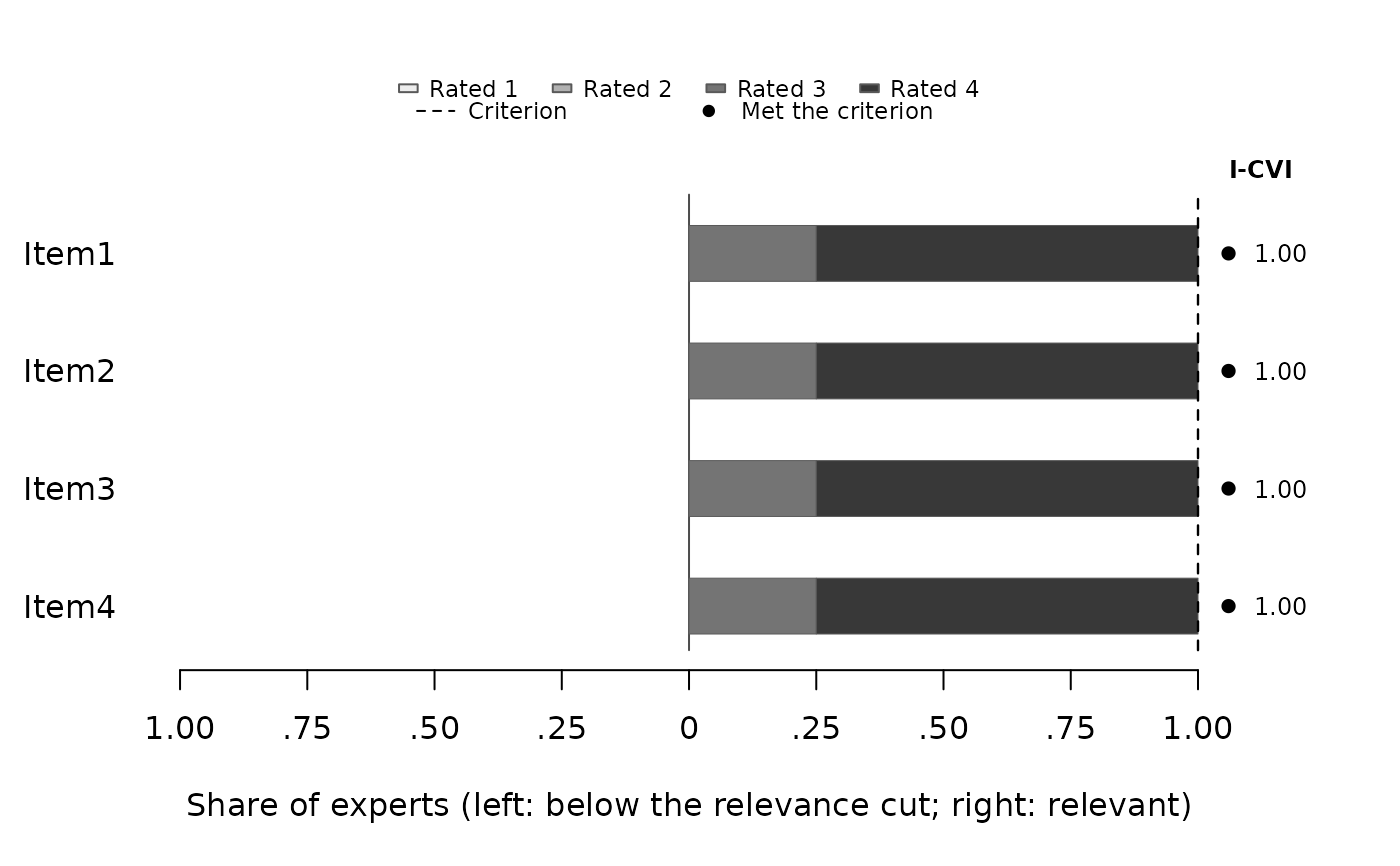
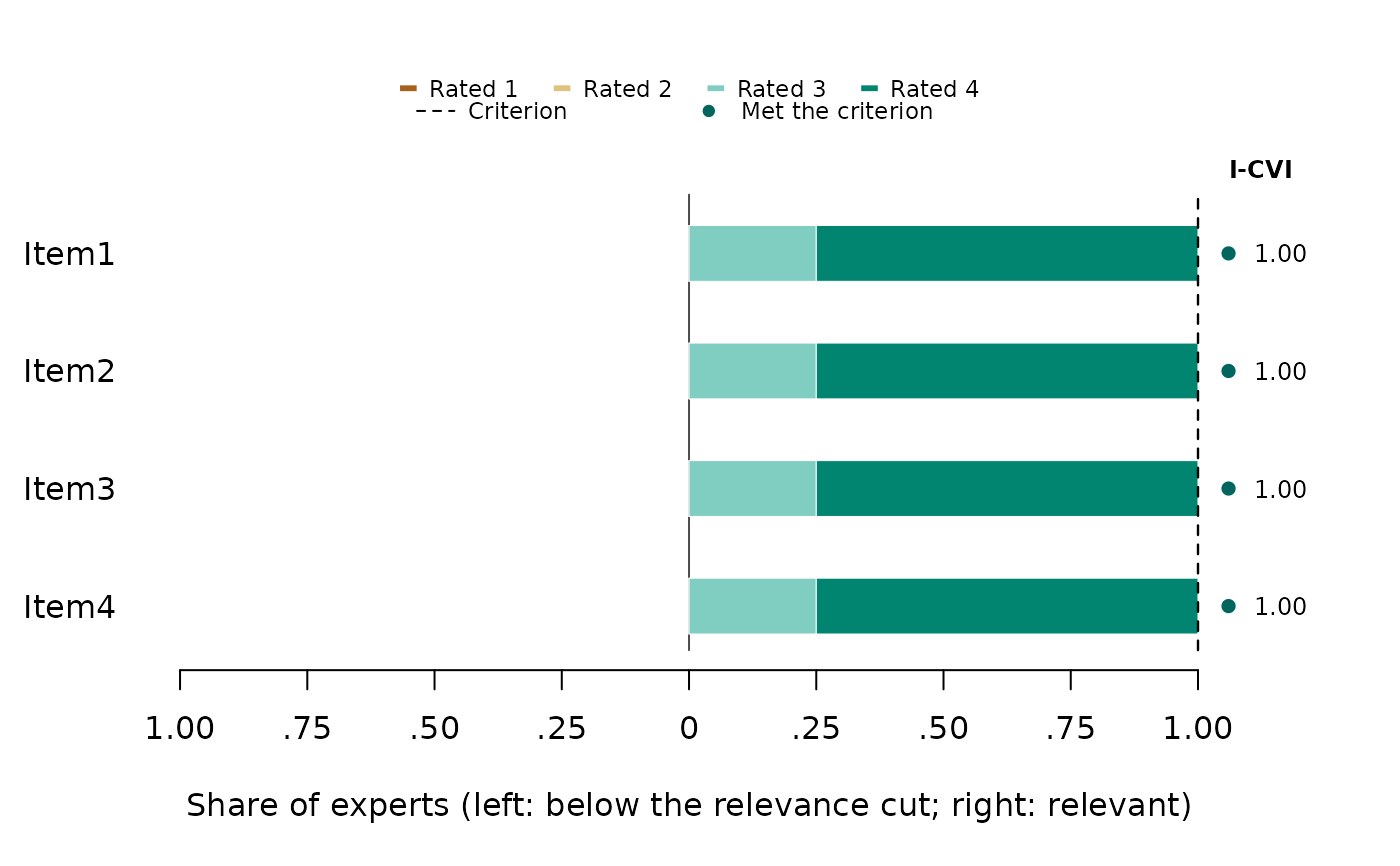
In relevance mode, type = "distribution" draws every expert's rating as
a diverging stacked bar (Heiberger & Robbins, 2014), split at the relevance
cut. Ratings below the cut extend left and ratings at or above it extend
right, so the right-hand length is the item's I-CVI, read against the dashed
criterion line. The number beside each bar is that I-CVI, and the symbol is
the decision the fit made. It shows what the index cannot: two items with
the same I-CVI, one rated relevant with 4s and the other with 3s.
Arguments
- x
A
contentvalid_expertobject.- show_legend
Logical; draw the compact plot key. Default
TRUE.- type
"item"(default) for the evidence plot described above, or"distribution"for the rating distributions (relevance mode only).- apa
Used by
type = "distribution".TRUE(default) draws in gray, with darker meaning a higher rating, as an APA figure is printed.FALSEdraws ratings below the cut in brown and ratings at or above it in teal, a colorblind-safe scheme for slides and posters. The symbol beside each bar carries the decision either way. The"item"plot is always gray.- labels
For
type = "distribution", one label per rating category, lowest first, such asc("Not relevant", "Somewhat relevant", "Quite relevant", "Highly relevant"). Defaults to"Rated 1","Rated 2", and so on.- ...
Additional graphical arguments passed to
graphics::plot().
References
Heiberger, R. M., & Robbins, N. B. (2014). Design of diverging stacked bar charts for Likert scales and other applications. Journal of Statistical Software, 57(5), 1–32. doi:10.18637/jss.v057.i05
Examples
relevance <- matrix(
c(4,4,4,3, 4,4,3,4, 3,4,4,4, 4,3,4,4),
nrow = 4,
dimnames = list(NULL, paste0("Item", 1:4))
)
fit <- expert_validity(relevance, mode = "relevance", lo = 1, hi = 4,
agreement = "none")
plot(fit)
 plot(fit, type = "distribution")
 plot(fit, type = "distribution", apa = FALSE)
 plot(expert_validity(c(10, 8, 6), mode = "essentiality", N = 12))