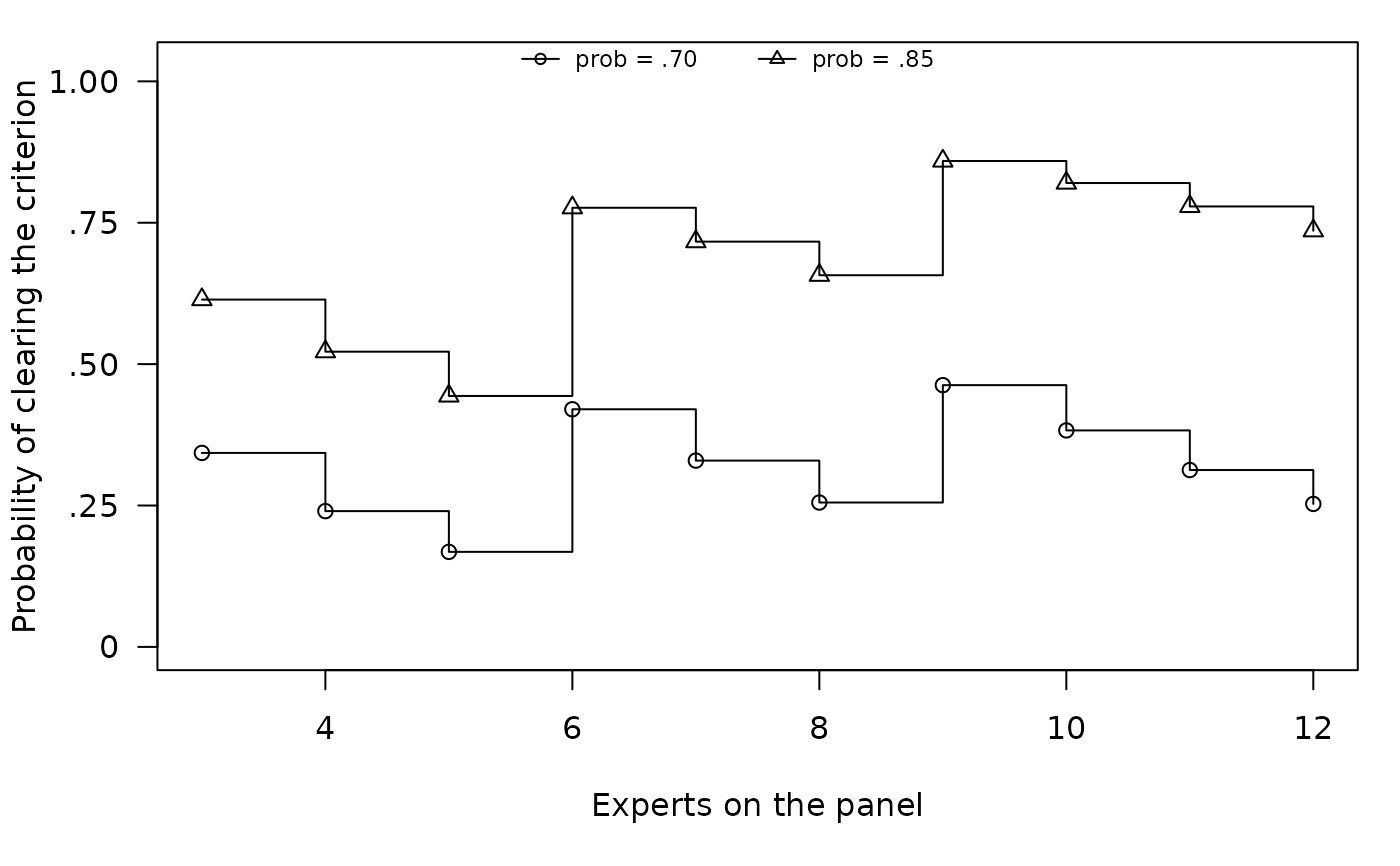
Draws the probability that an item clears the criterion against the number of experts on the panel, as a step function because the criterion itself changes with panel size. Each assumed endorsement probability is a solid line told apart by its marker. The key sits above the curves, and the panel-size axis is ticked at whole numbers of experts.
Usage
# S3 method for class 'contentvalid_expert_power'
plot(x, show_legend = TRUE, type = "probability", ...)
Arguments
- x
A
contentvalid_expert_powerobject.- show_legend
Draw the key identifying each assumed endorsement probability.
- type
"probability", the only view, accepted so that every plot method takestype.- ...
Passed to
graphics::plot().
Examples
plot(expert_power(n_experts = 3:12, prob = c(0.7, 0.85)))