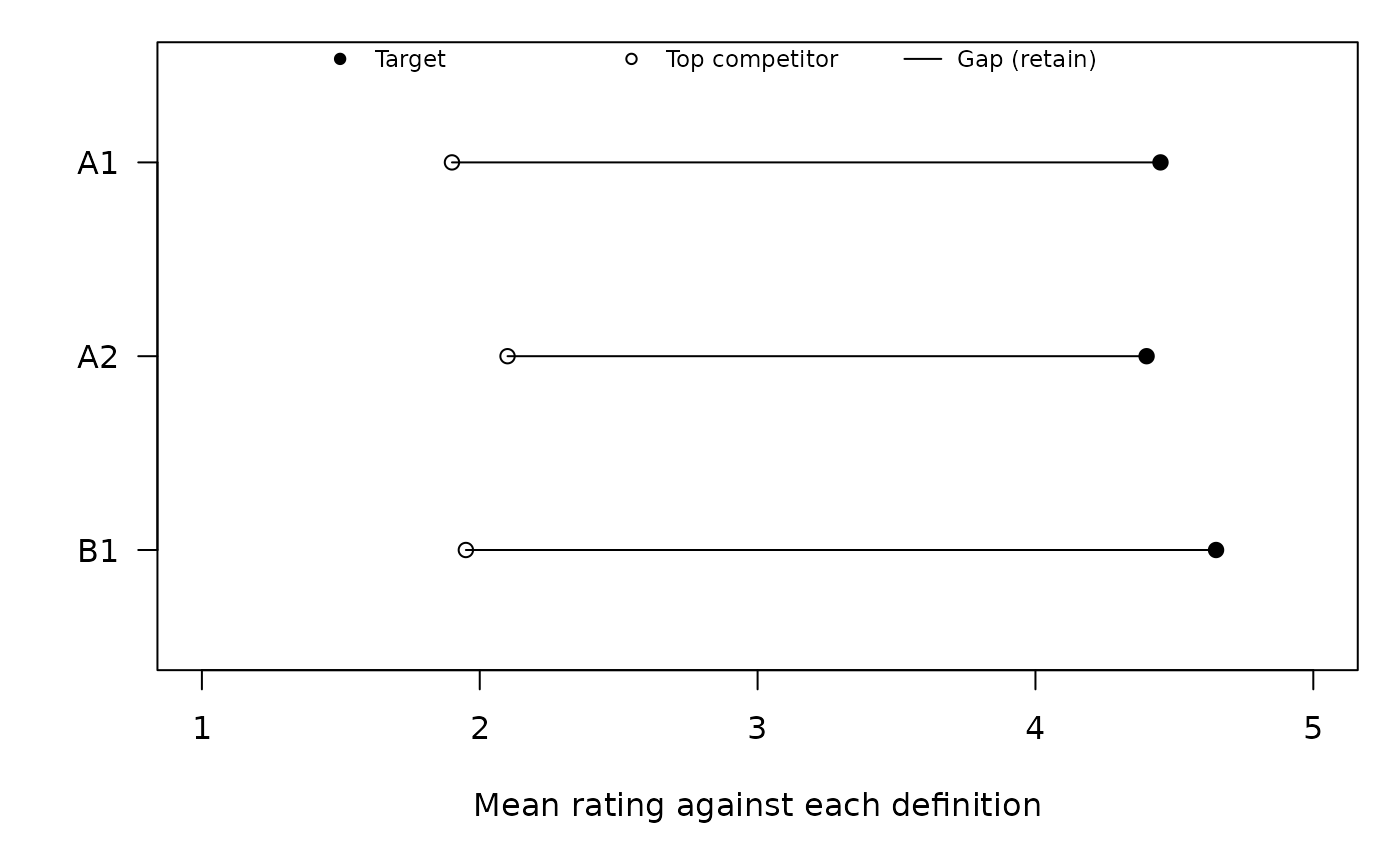
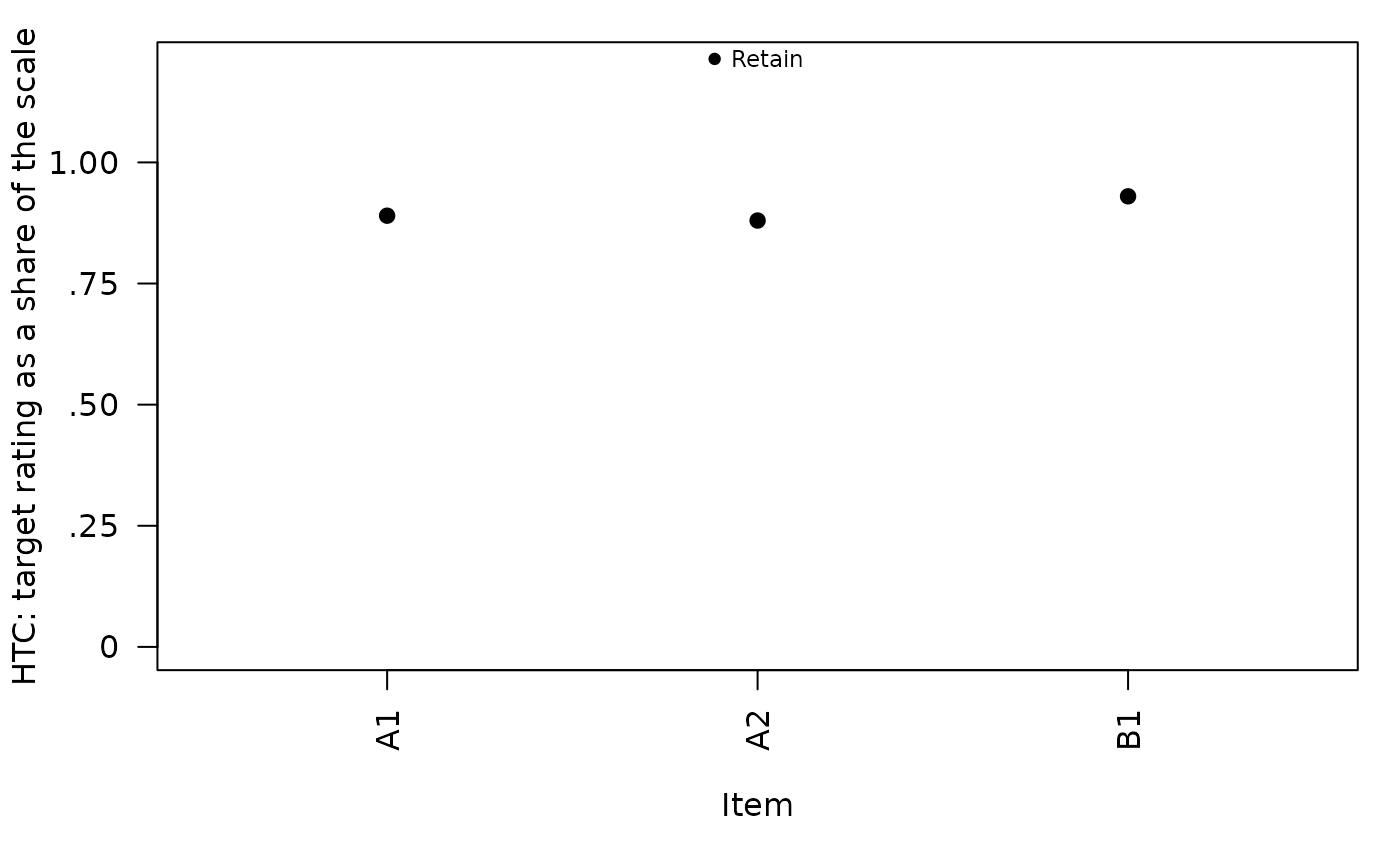
Provides three complementary views of a construct-rating pretest. "item"
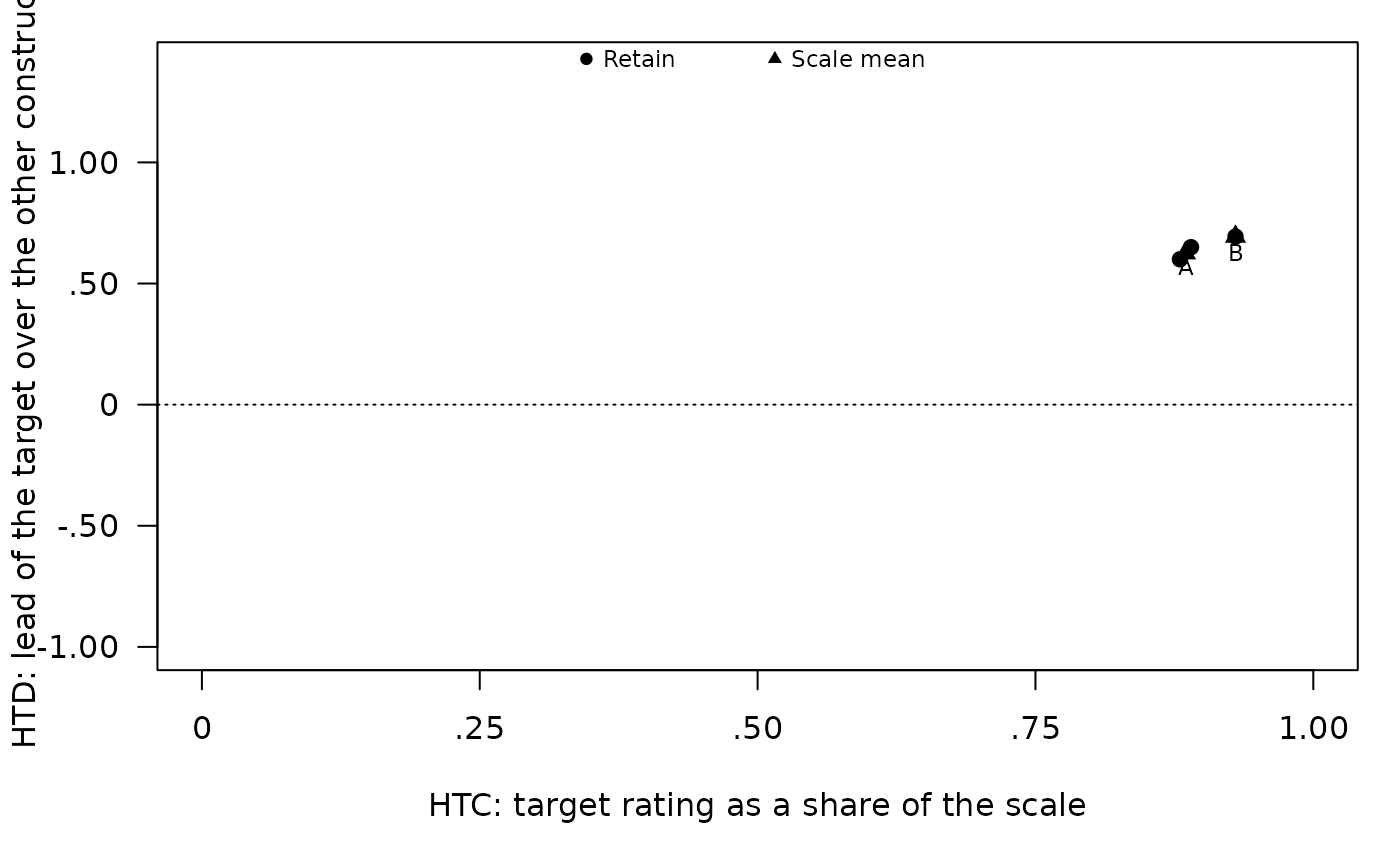
reproduces the original one-index plot, "map" places HTC against HTD to show
correspondence and distinctiveness jointly, and "profile" draws a target-versus-
strongest-competitor gap plot on the original response scale, first item at
the top, with a dashed gap for items to review. The profile view is a
graphical analogue of the mean-rating tables used in Hinkin and Tracey
(1999). Both ends of a gap are means over the judges who rated the item
against every construct, the judges the tests use. An item without a
decision has no gap: a cross marks its mean target rating.
The key sits above the data, in as many rows as the figure's width needs. Where a vertical axis title would not fit the figure's height, as the HTD title does at 7 by 4 inches, the axis shows the index's name alone and the key's heading gives the full definition. The item plot widens its bottom margin for long item names, shortening a name in the middle with "..." when it would take more than about 40% of the figure's height.
Arguments
- x
A
contentvalid_ratingobject.- metric
Either
"htc"or"htd"fortype = "item".- type
One of
"item","map", or"profile".- label
Which item labels to draw on the map:
"review"(default),"all", or"none".- show_legend
Logical; draw the compact plot key. Default
TRUE.- ...
Additional graphical arguments passed to
graphics::plot().
References
Hinkin, T. R., & Tracey, J. B. (1999). An analysis of variance approach to content validation. Organizational Research Methods, 2(2), 175–186. doi:10.1177/109442819922004
Examples
set.seed(12)
d <- expand.grid(item = c("A1", "A2", "B1"), rater = 1:20,
construct = c("A", "B", "C"))
d$target_construct <- ifelse(d$item == "B1", "B", "A")
d$rating <- ifelse(d$construct == d$target_construct,
pmin(5, pmax(1, round(rnorm(nrow(d), 4.5, .6)))),
pmin(5, pmax(1, round(rnorm(nrow(d), 2.0, .7)))))
fit <- rating_validity(d, scale_min = 1, scale_max = 5)
plot(fit)
 plot(fit, type = "map")
 plot(fit, type = "profile")