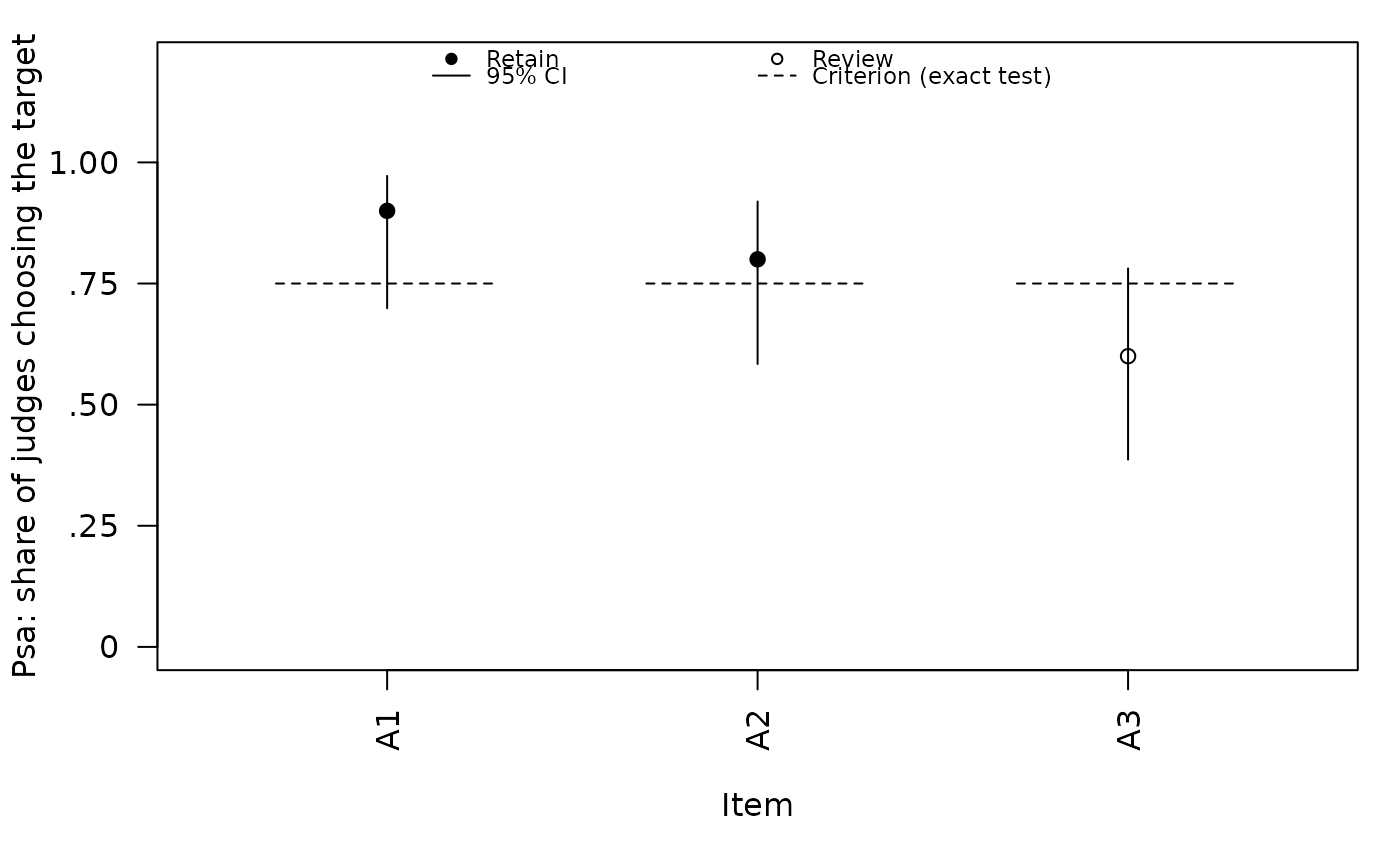
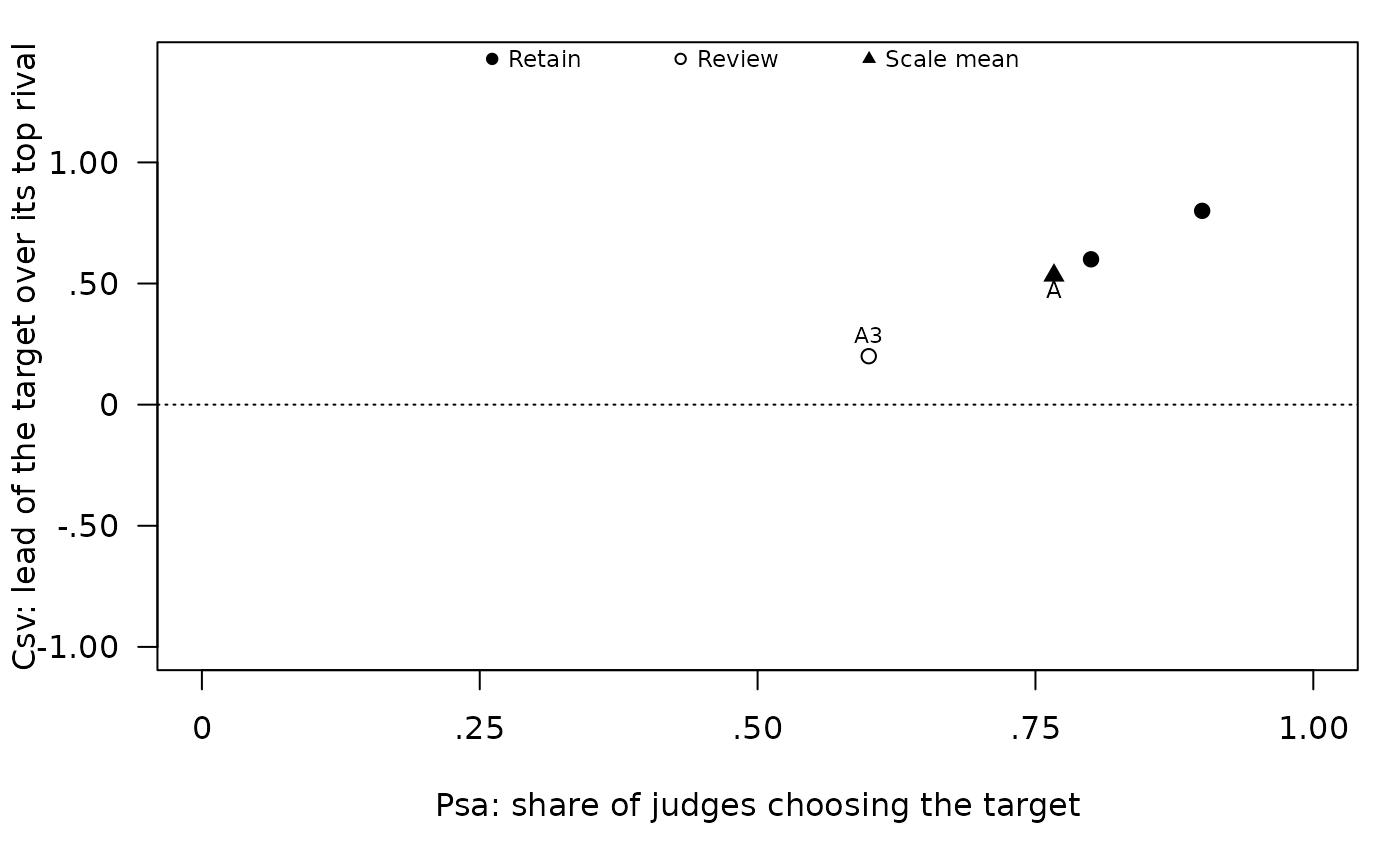
Draws either the original one-index item plot or a correspondence-distinctiveness evidence map. The Psa item plot draws each item's interval and a dashed mark at the share of judges the exact test needs for that item, so an item is retained when its point reaches its mark. The map places Psa on the x-axis and Csv on the y-axis so that intended-construct correspondence and distinctiveness can be inspected together. Target-scale means are added as triangles when available. Colquitt benchmark bands are deliberately not drawn across item points because those norms were developed for scale-level averages rather than individual items.
The key sits above the data, in as many rows as the figure's width needs. Where a vertical axis title would not fit the figure's height, the axis shows the index's name alone (Psa or Csv) and the key's heading gives the full definition. The item plot widens its bottom margin for long item names, shortening a name in the middle with "..." when it would take more than about 40% of the figure's height.
Arguments
- x
A
contentvalid_sortobject.- metric
Either
"psa"or"csv"fortype = "item".- type
Either
"item"for the original one-index plot or"map"for the correspondence-distinctiveness evidence map.- label
Which item labels to draw on the map:
"review"(default),"all", or"none".- show_legend
Logical; draw the compact plot key. Default
TRUE.- ...
Additional graphical arguments passed to
graphics::plot().