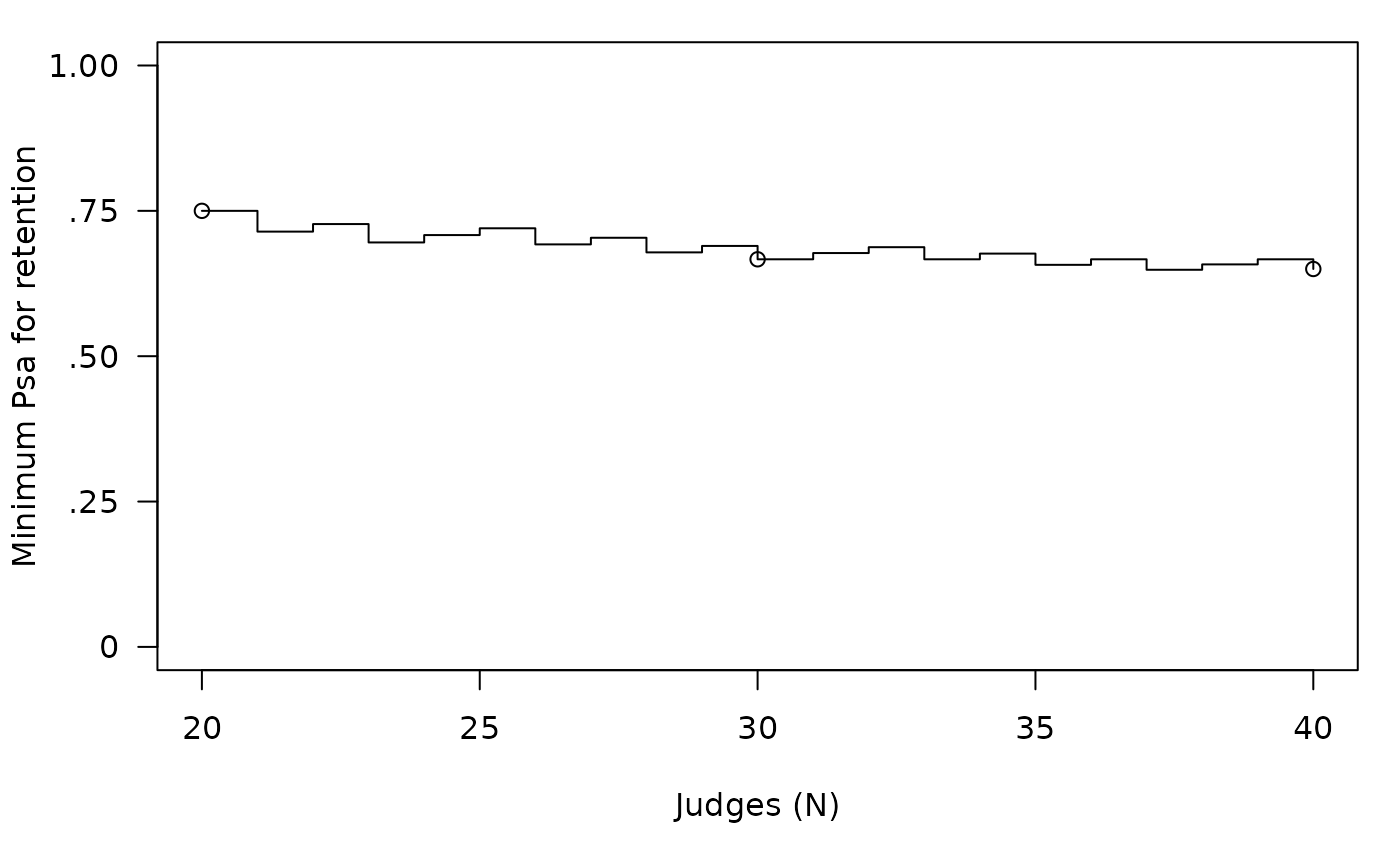
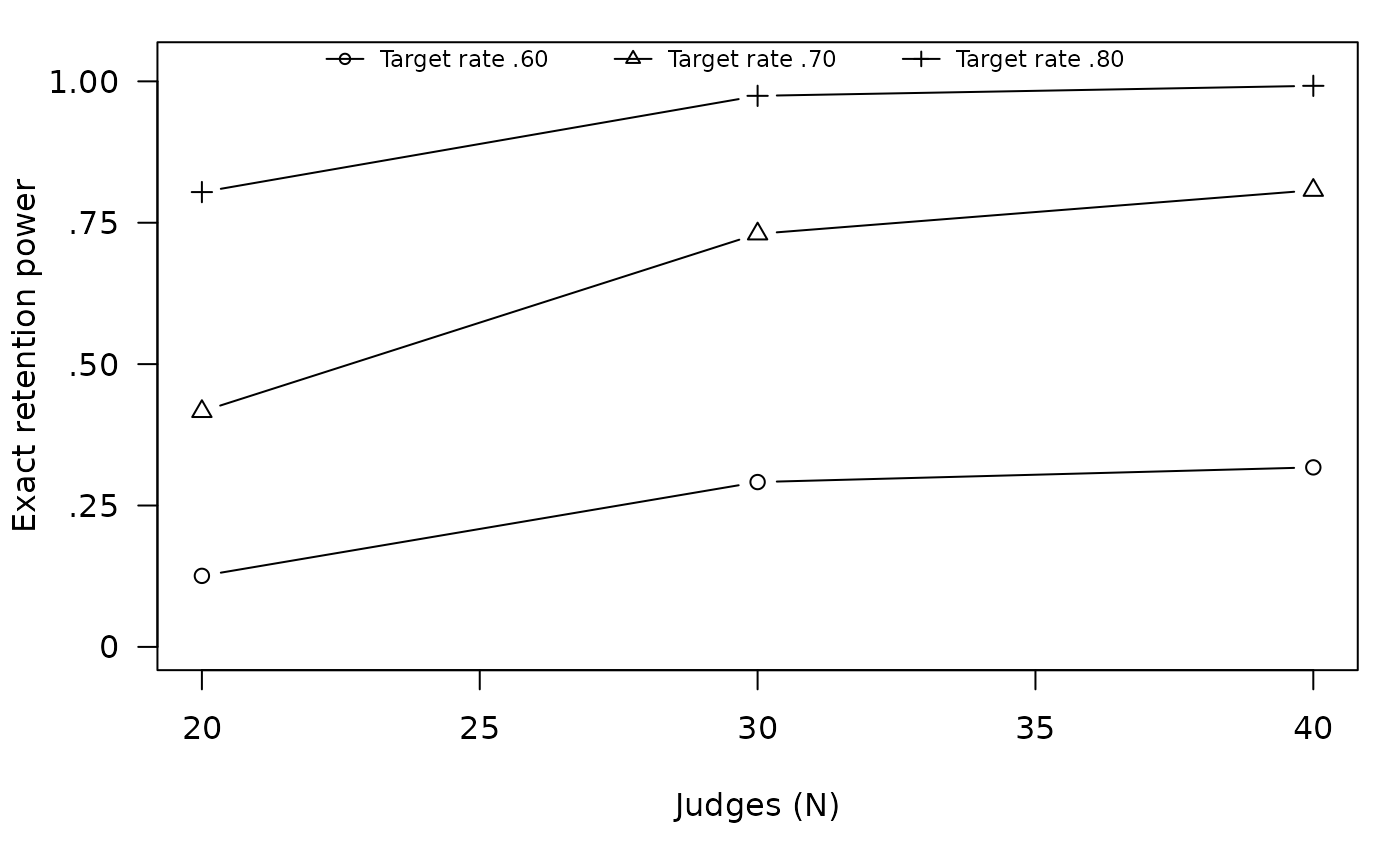
Visualizes either exact Howard-Melloy retention power across planned judge sample sizes or the minimum observed Psa implied by the exact critical target count. The critical view is drawn as a step function over every integer judge count in the displayed range, reflecting the discrete exact-binomial rule. Multiple assumed true target-assignment probabilities are solid lines told apart by their plotting symbols rather than by color, and a dashed line marks the reference power when one is given. The key sits above the curves, and the judge axis is ticked at whole numbers of judges.
Arguments
- x
A
contentvalid_sort_powerobject.- type
Either
"power"or"critical".- reference_power
Optional horizontal reference value for
type = "power", one probability between 0 and 1. No conventional target is imposed by default.- show_legend
Logical; draw the compact power-series key. Default
TRUE.- ...
Additional graphical arguments passed to
graphics::plot().
Examples
plan <- sort_power(N = c(20, 30, 40), true_p = c(.60, .70, .80))
plot(plan)
 plot(plan, type = "critical")