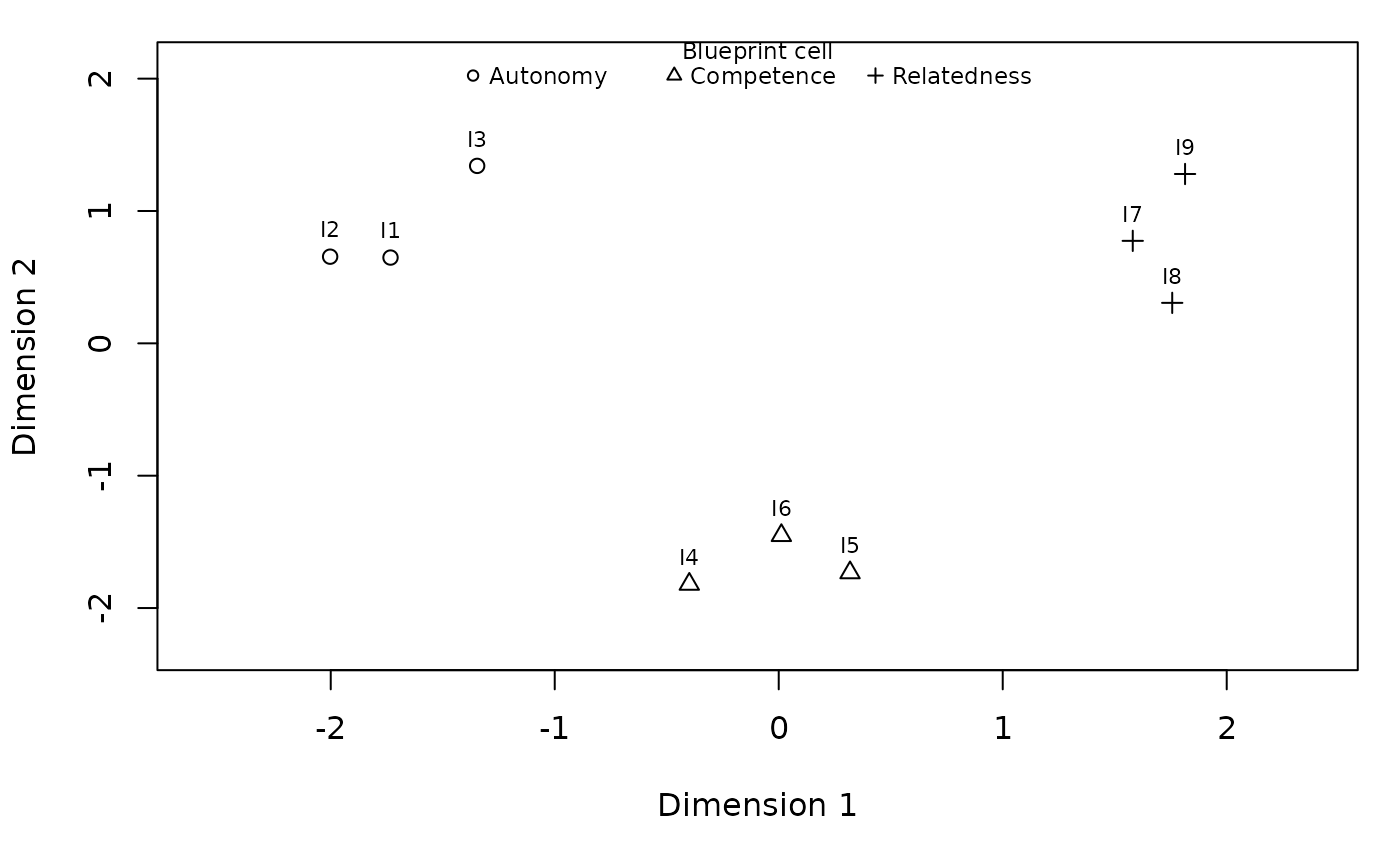
Plots the multidimensional scaling content map from content_structure(),
with each item positioned by expert-perceived similarity, labeled by its
name, and drawn with its blueprint cell's symbol (its recovered cluster's,
when no blueprint was supplied), which the key names. Items that sit away
from others sharing their cell are the ones experts did not group as the
blueprint expects.
A map with one usable dimension is drawn as a strip, each name to the right of its point. Items whose names would run into each other, such as items at the same position, are stacked one above another; on a strip the height carries no meaning.
Usage
# S3 method for class 'contentvalid_structure'
plot(x, show_legend = TRUE, type = "map", ...)
Arguments
- x
A
contentvalid_structureobject.- show_legend
Draw the blueprint-cell key.
- type
"map", the only view, accepted so that every plot method takestype.- ...
Passed to
graphics::plot(). An argument given here, such asxlab,xlimormain, replaces the one the method would set. Apchorcolwith one value per blueprint cell (or cluster) is applied cell by cell and shown in the key; apchof any other length leaves the key out, because it could no longer tell the cells apart.
Examples
items <- paste0("I", 1:9)
blueprint <- rep(c("Autonomy", "Competence", "Relatedness"), each = 3)
sim <- matrix(c(
  5, 4, 3, 2, 2, 1, 1, 2, 1,
  4, 5, 4, 3, 1, 2, 2, 1, 1,
  3, 4, 5, 1, 2, 2, 1, 1, 3,
  2, 3, 1, 5, 4, 3, 2, 2, 1,
  2, 1, 2, 4, 5, 4, 1, 3, 2,
  1, 2, 2, 3, 4, 5, 2, 1, 2,
  1, 2, 1, 2, 1, 2, 5, 3, 4,
  2, 1, 1, 2, 3, 1, 3, 5, 4,
  1, 1, 3, 1, 2, 2, 4, 4, 5
), 9, 9, dimnames = list(items, items))
plot(content_structure(sim, membership = blueprint))