Plot content evidence across review stages
Source:R/content_evidence.R
plot.contentvalid_evidence.RdDraws the two figures of content_evidence().
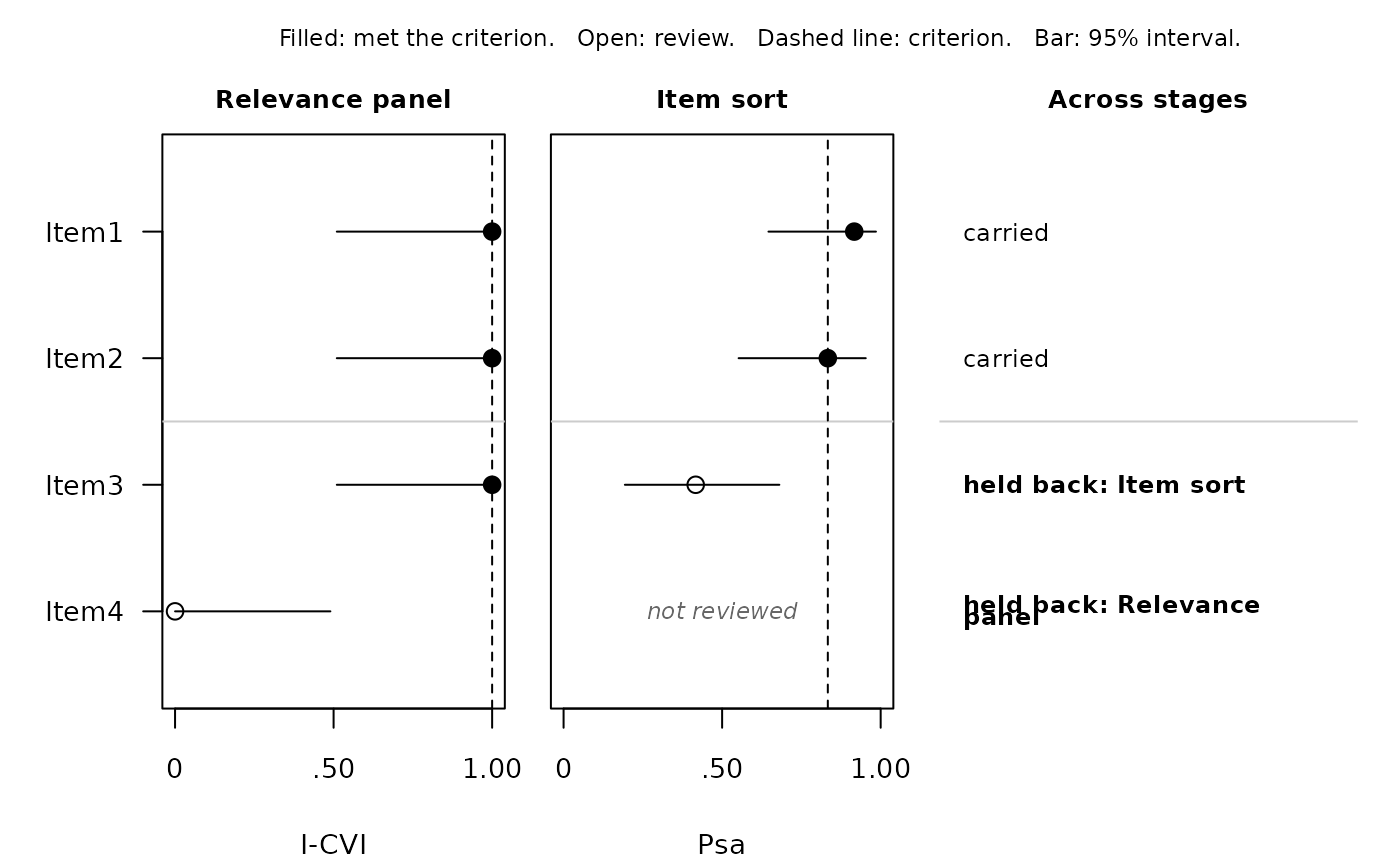
type = "profile" (default), the item evidence profile, gives one panel
per stage with the items down the side. Each panel shows the statistic
behind that stage's decisions, its interval as a bar, and, where the
stage's rule has one, its criterion as a dashed line. Construct ratings
have none: that workflow decides on planned contrasts, not on the HTC
shown. A filled symbol met the stage's decision rule, an open one was
flagged for review, and a cross marks an item the stage did not judge
against a criterion (it only described it, or too few raters rated it). On a
small device, panel titles are shortened with "..."; their numbers match the
printout's list of stages. "no value" marks an item
the stage reviewed without a statistic, and "not reviewed" one it did not
see. The last column says whether each item was carried, names the stages
that held it back, or reads "no decision" for an item no stage applied a
decision rule to. When the stages' names would not fit beside their item,
it gives their numbers instead, and the panel titles are numbered to match;
numbers that would still wrap into the next row are set on one line at 8
points in a wider column. Every item is named down the side, in type sized
to the rows. Faint lines separate the constructs. The legend lists only
what was drawn, and no text is smaller than 8 points: text that does not
fit is wrapped rather than run off the figure.
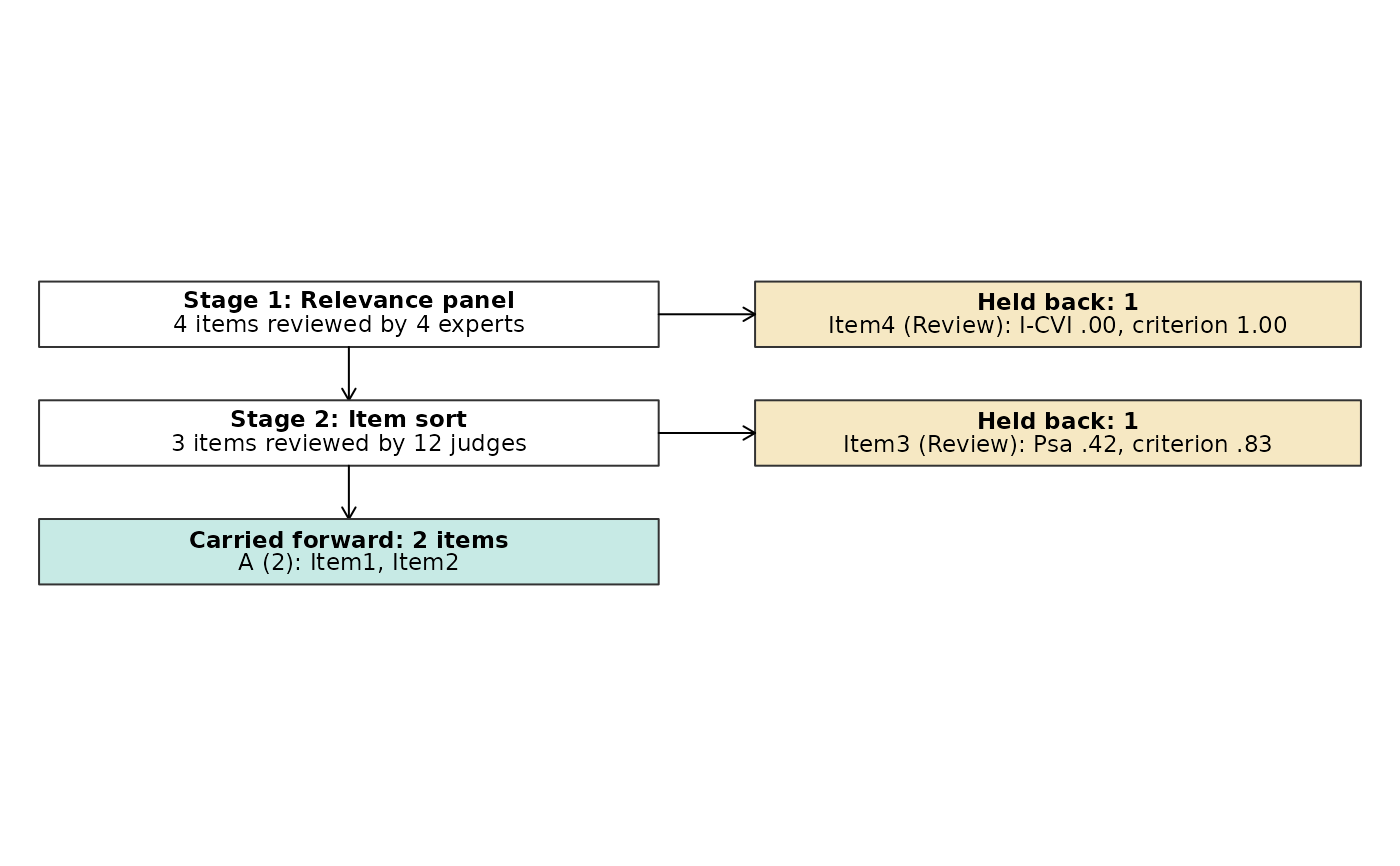
type = "flow", the item flow diagram, follows the items through the
stages, modeled on the PRISMA 2020 flow diagram (Page et al., 2021). Each
stage's box gives how many items it reviewed and by how many judges; its
side box lists each item it held back, with the decision and the number
behind it; and the last box lists the items carried forward, by construct,
with any item no stage applied a decision rule to in a box beside it. Its
text is set at 8 points or more, with a line too wide for its box wrapped,
wherever the device is tall enough to hold the whole diagram at that size;
a shorter device sets it smaller. At 7 by 4 inches that holds three stages
with short names, and at 5 by 3.5 inches one or two; three stages with
long names or long item names want about 7.5 by 5.5 inches.
Arguments
- x
A
contentvalid_evidenceobject.- type
"profile"or"flow".- apa
TRUE(default) draws in black, white, and gray, as an APA figure is printed.FALSEmarks evidence that met its criterion in teal and evidence under review in brown, a colorblind-safe scheme for slides and posters. Symbols carry the decision either way, so neither reading depends on color.- show_legend
Draw the key above the profile. Default
TRUE.- ...
Additional graphical arguments passed to
graphics::plot()for each panel of the profile. The flow diagram does not use them.
References
Page, M. J., McKenzie, J. E., Bossuyt, P. M., Boutron, I., Hoffmann, T. C., Mulrow, C. D., Shamseer, L., Tetzlaff, J. M., Akl, E. A., Brennan, S. E., Chou, R., Glanville, J., Grimshaw, J. M., Hróbjartsson, A., Lalu, M. M., Li, T., Loder, E. W., Mayo-Wilson, E., McDonald, S., . . . Moher, D. (2021). The PRISMA 2020 statement: An updated guideline for reporting systematic reviews. BMJ, 372, Article n71. doi:10.1136/bmj.n71
Examples
relevance <- matrix(
c(4,4,4,3, 4,4,3,4, 3,4,4,4, 2,2,1,2),
nrow = 4,
dimnames = list(NULL, paste0("Item", 1:4))
)
panel <- expert_validity(relevance, mode = "relevance", lo = 1, hi = 4,
agreement = "none")
sorts <- data.frame(
item = rep(paste0("Item", 1:3), each = 12),
rater = rep(1:12, 3),
target_construct = rep(c("A", "A", "B"), each = 12),
assigned_construct = c(rep("A", 11), "B", rep("A", 10), "B", "B",
rep("B", 5), rep("A", 7))
)
evidence <- content_evidence(`Relevance panel` = panel,
`Item sort` = sort_validity(sorts))
plot(evidence)
 plot(evidence, type = "flow", apa = FALSE)